Using Unit Dashboard
Introduction
Unit Dashboard designed to show full Unit status and all its monitoring. Here you can see all running services on nodes, their resource usage. Also, here you may see living service migration between nodes.
How to open Unit dashboard
- Login as
OEMorFleetOwneruser. - Got to
Unit DetailsPage and clickDashboardbutton.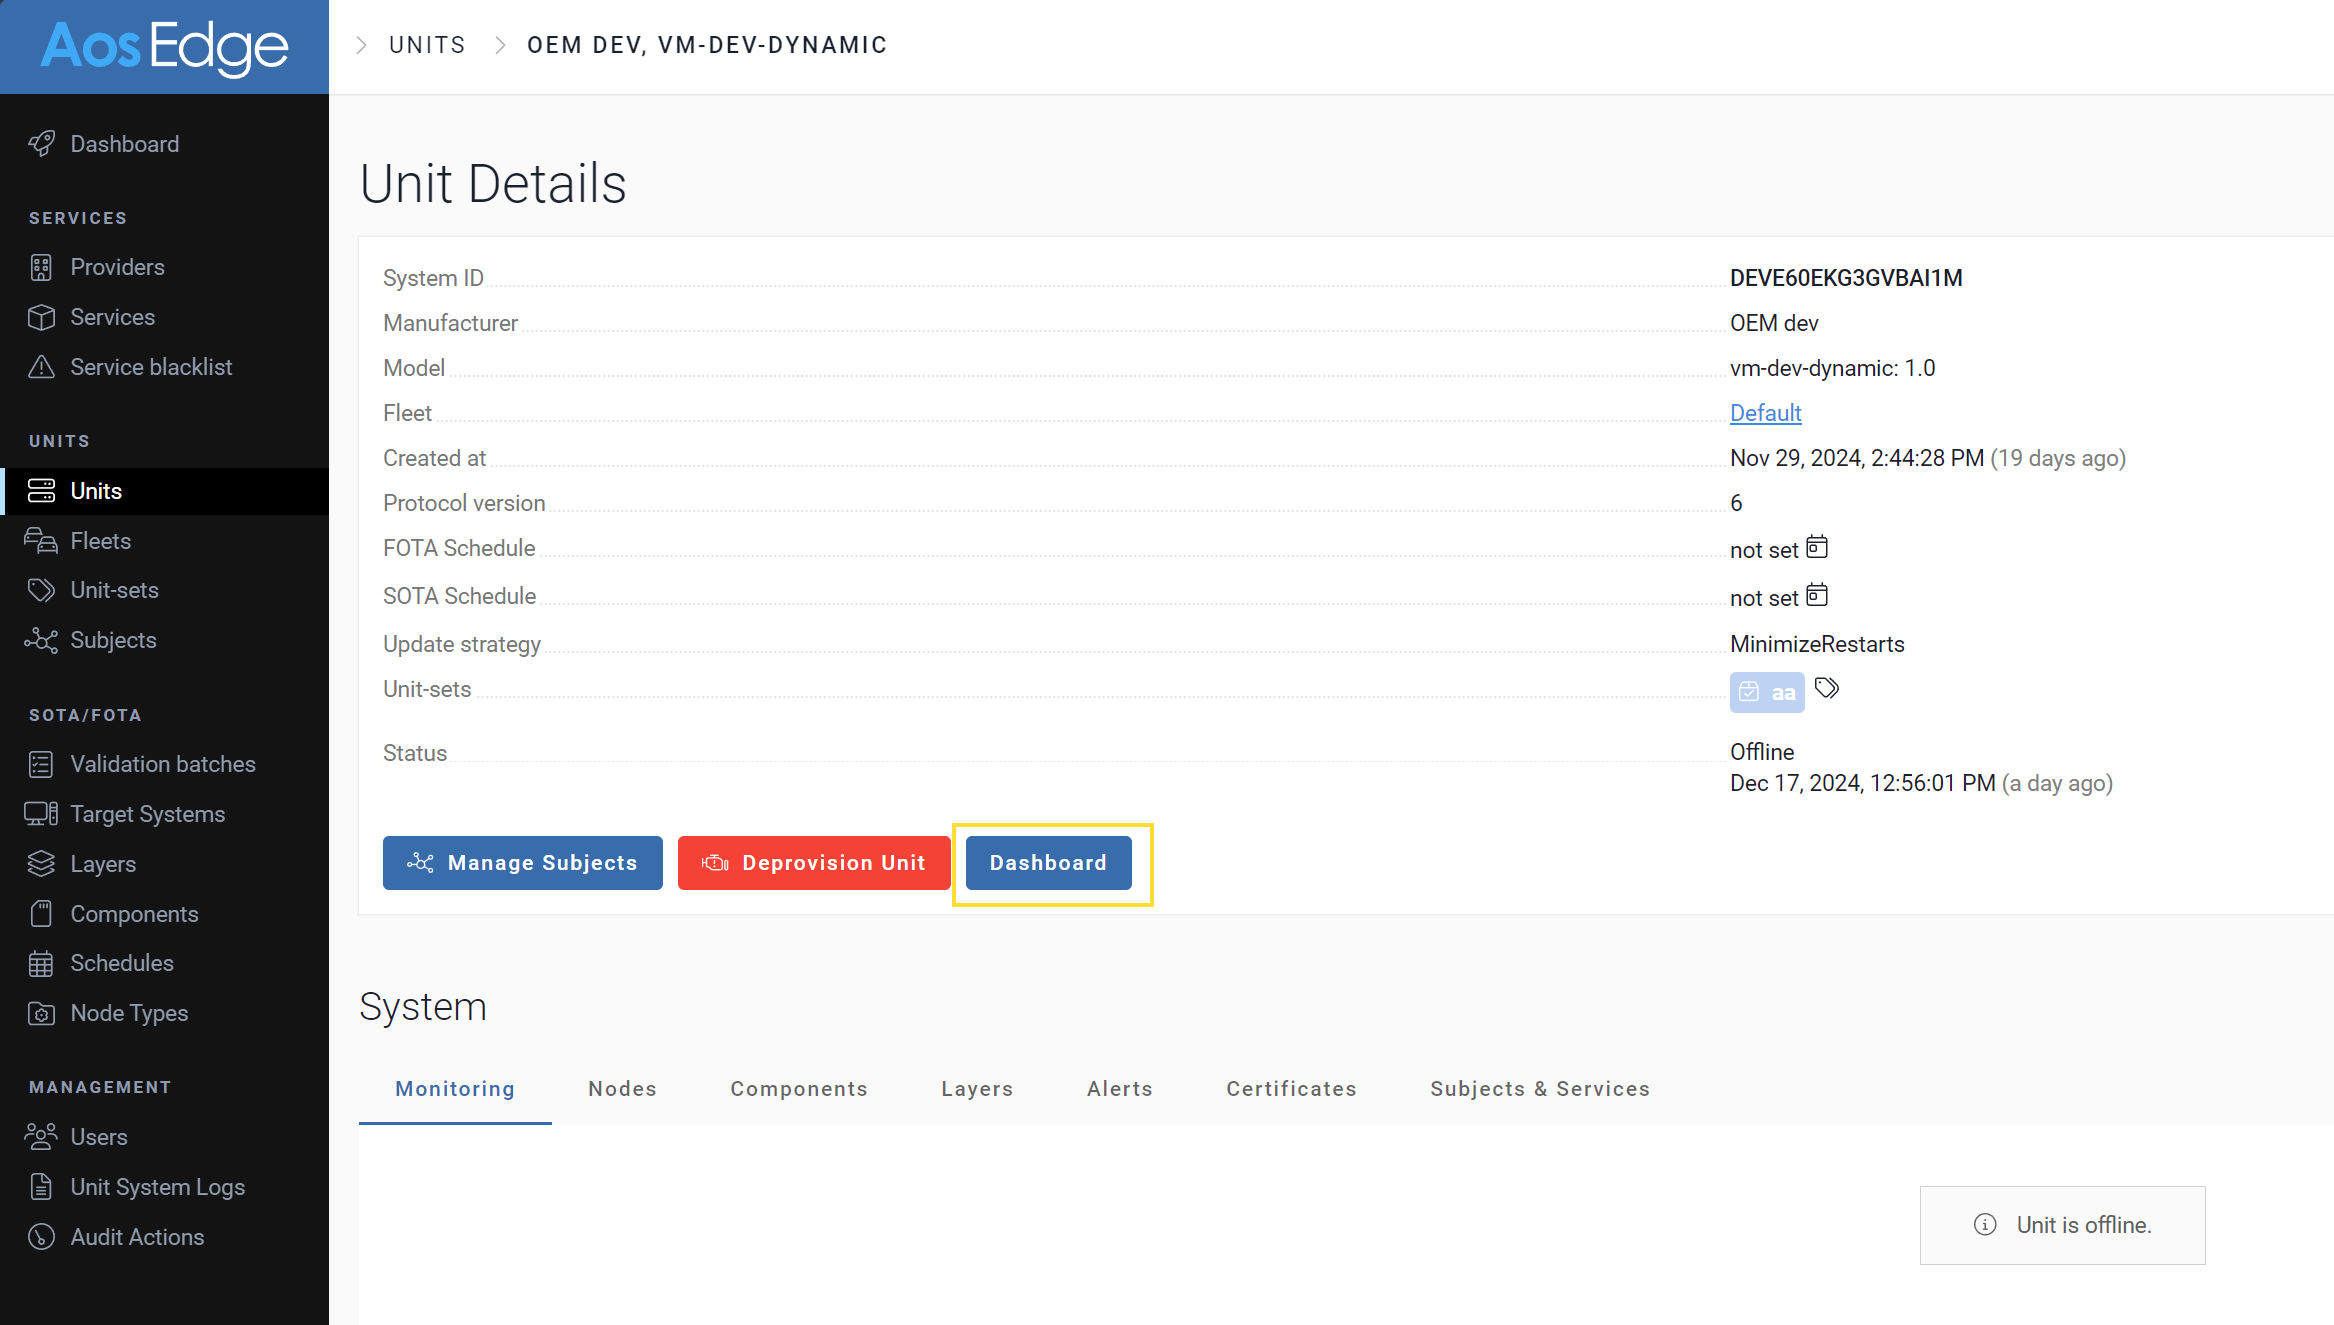
Overview
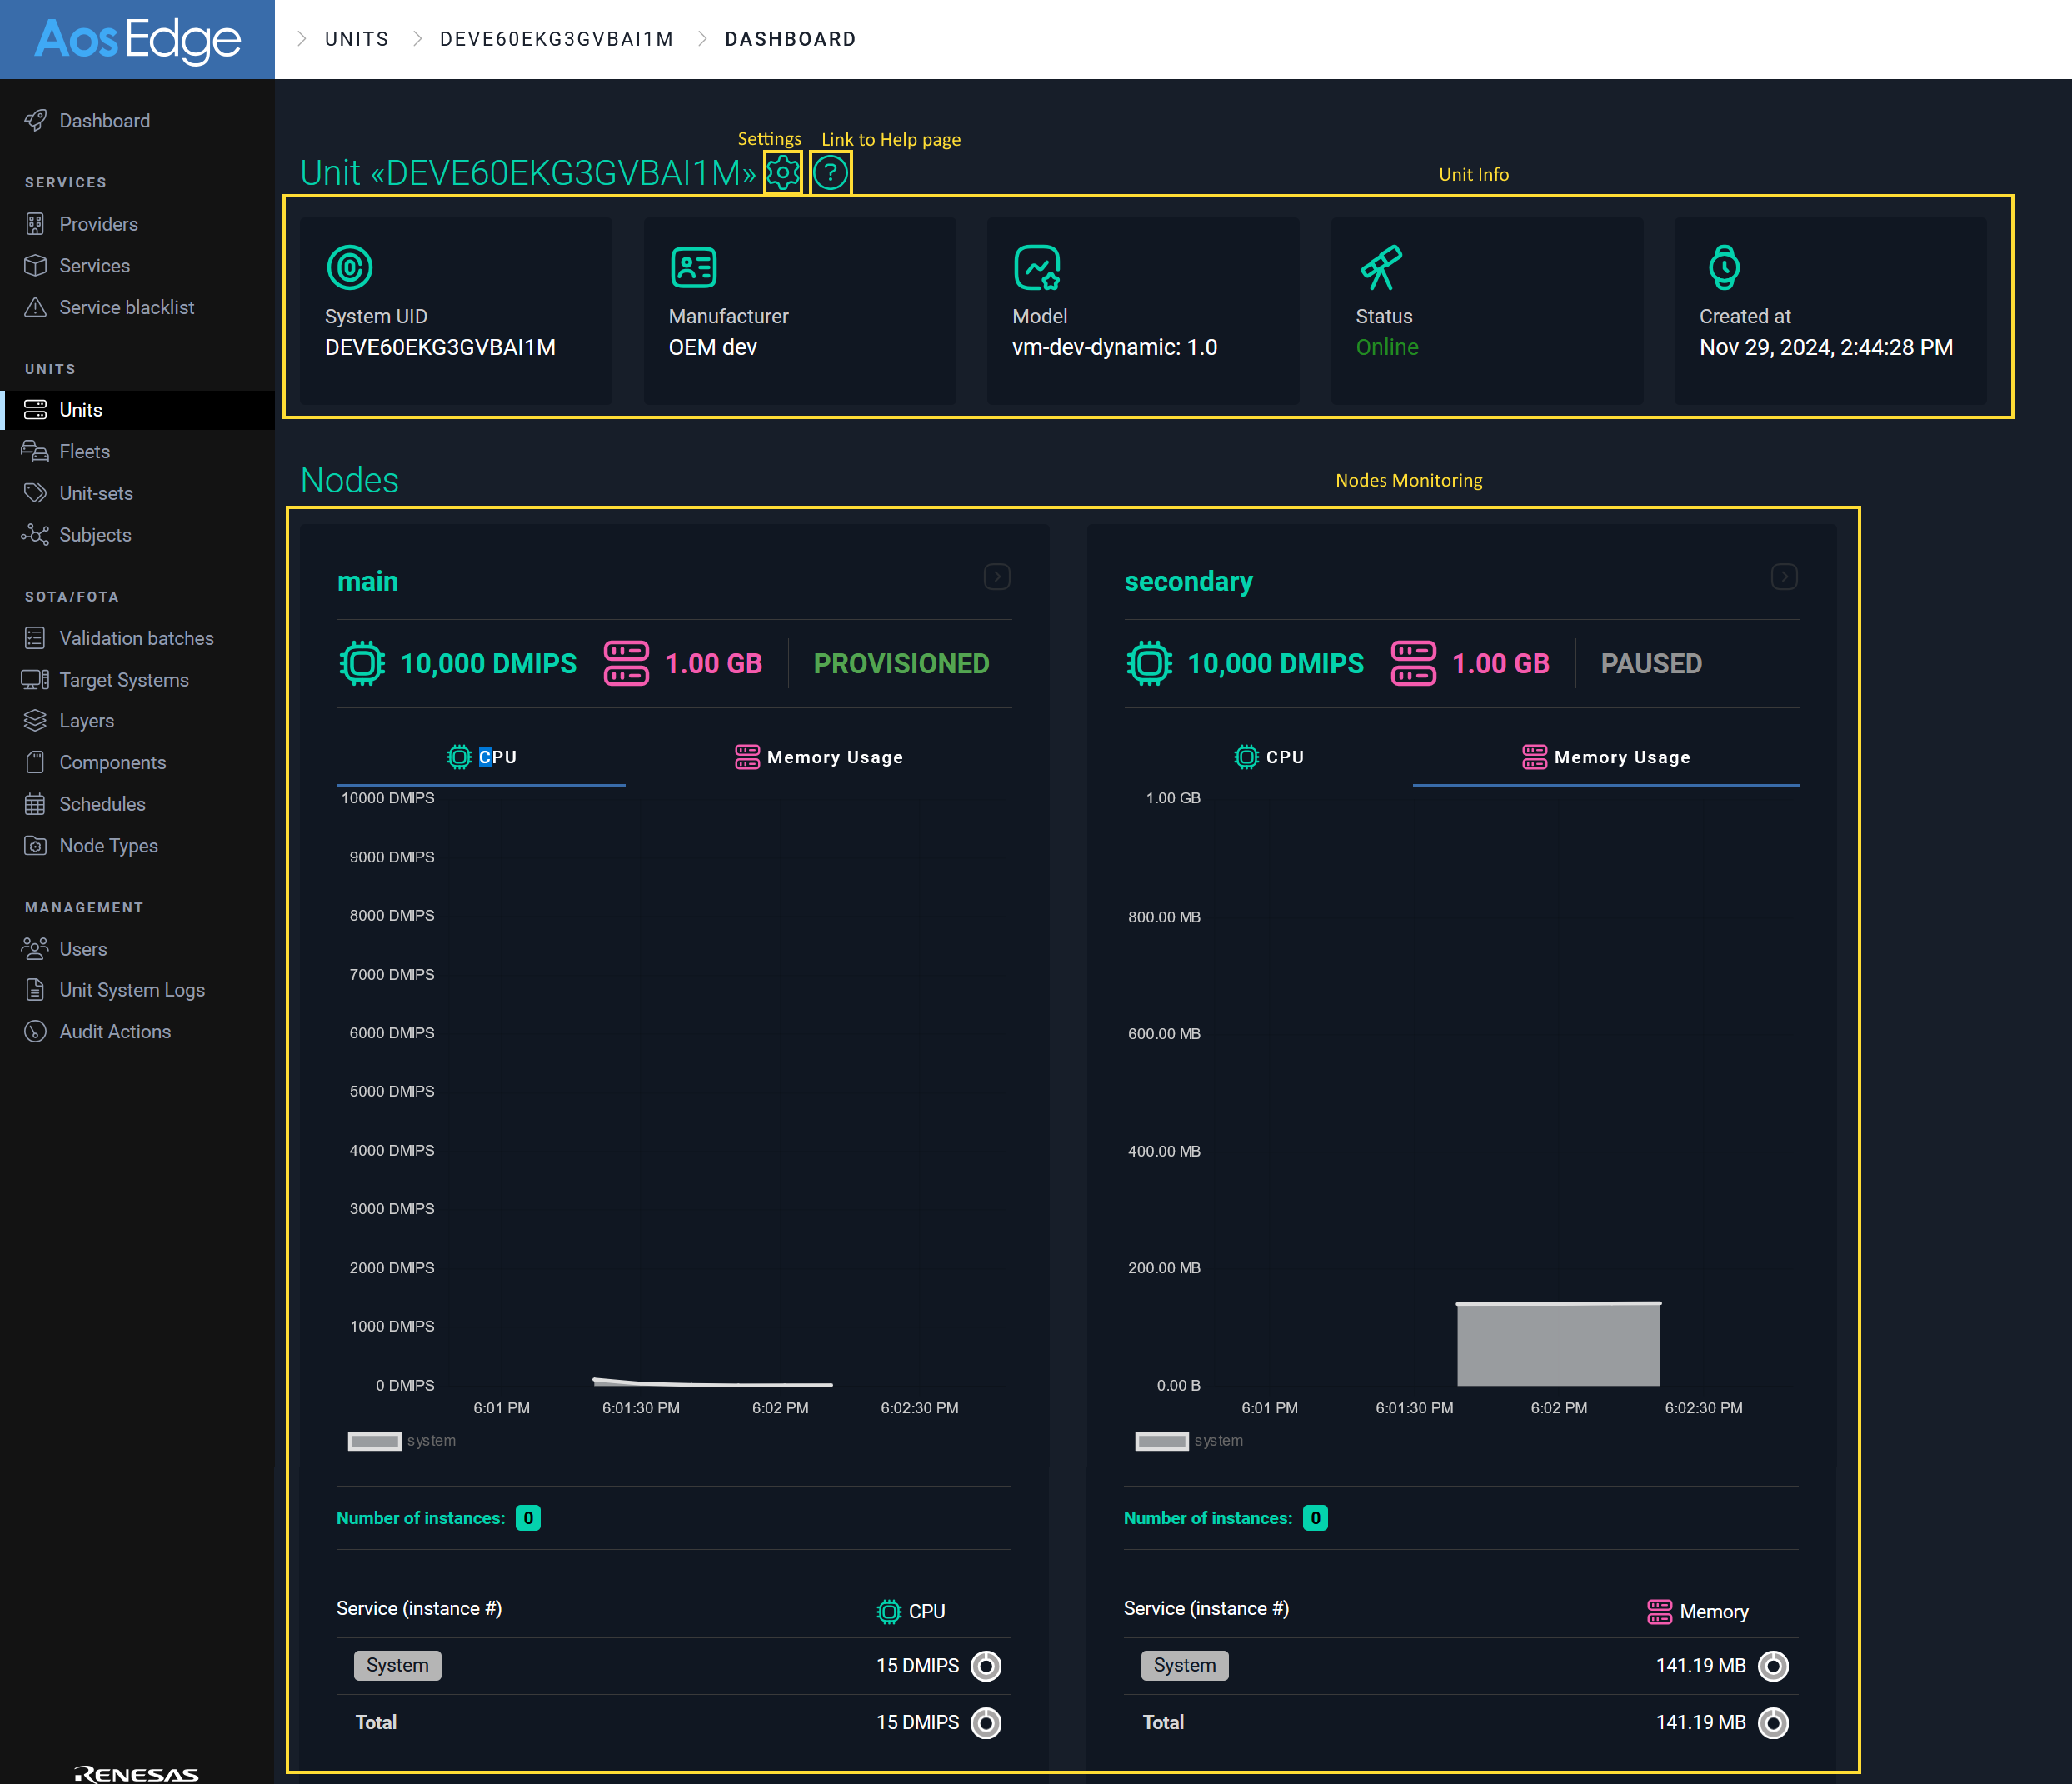
Show all nodes or single node
All nodes view
This mode is default. Here all nodes are displayed simultaneously but only with CPU or MEM monitoring.
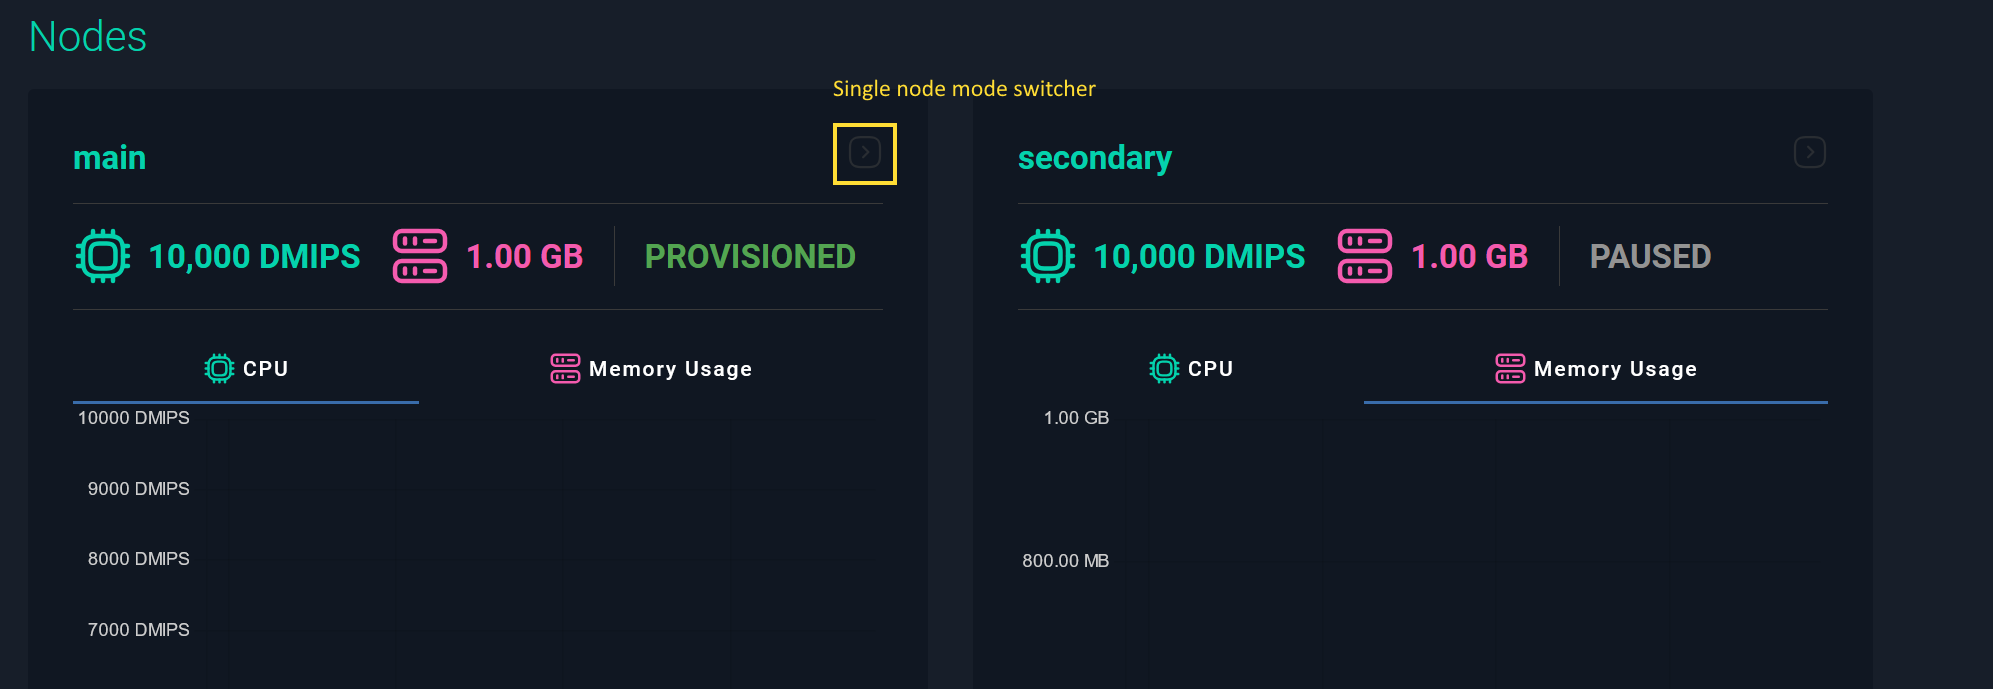 To change mode, click on the highlighted button.
Single node view
In this mode, only one selected node is displayed with all available monitoring.
 To change displayed node, click on green node name like on previous image.
What you see on dashboard
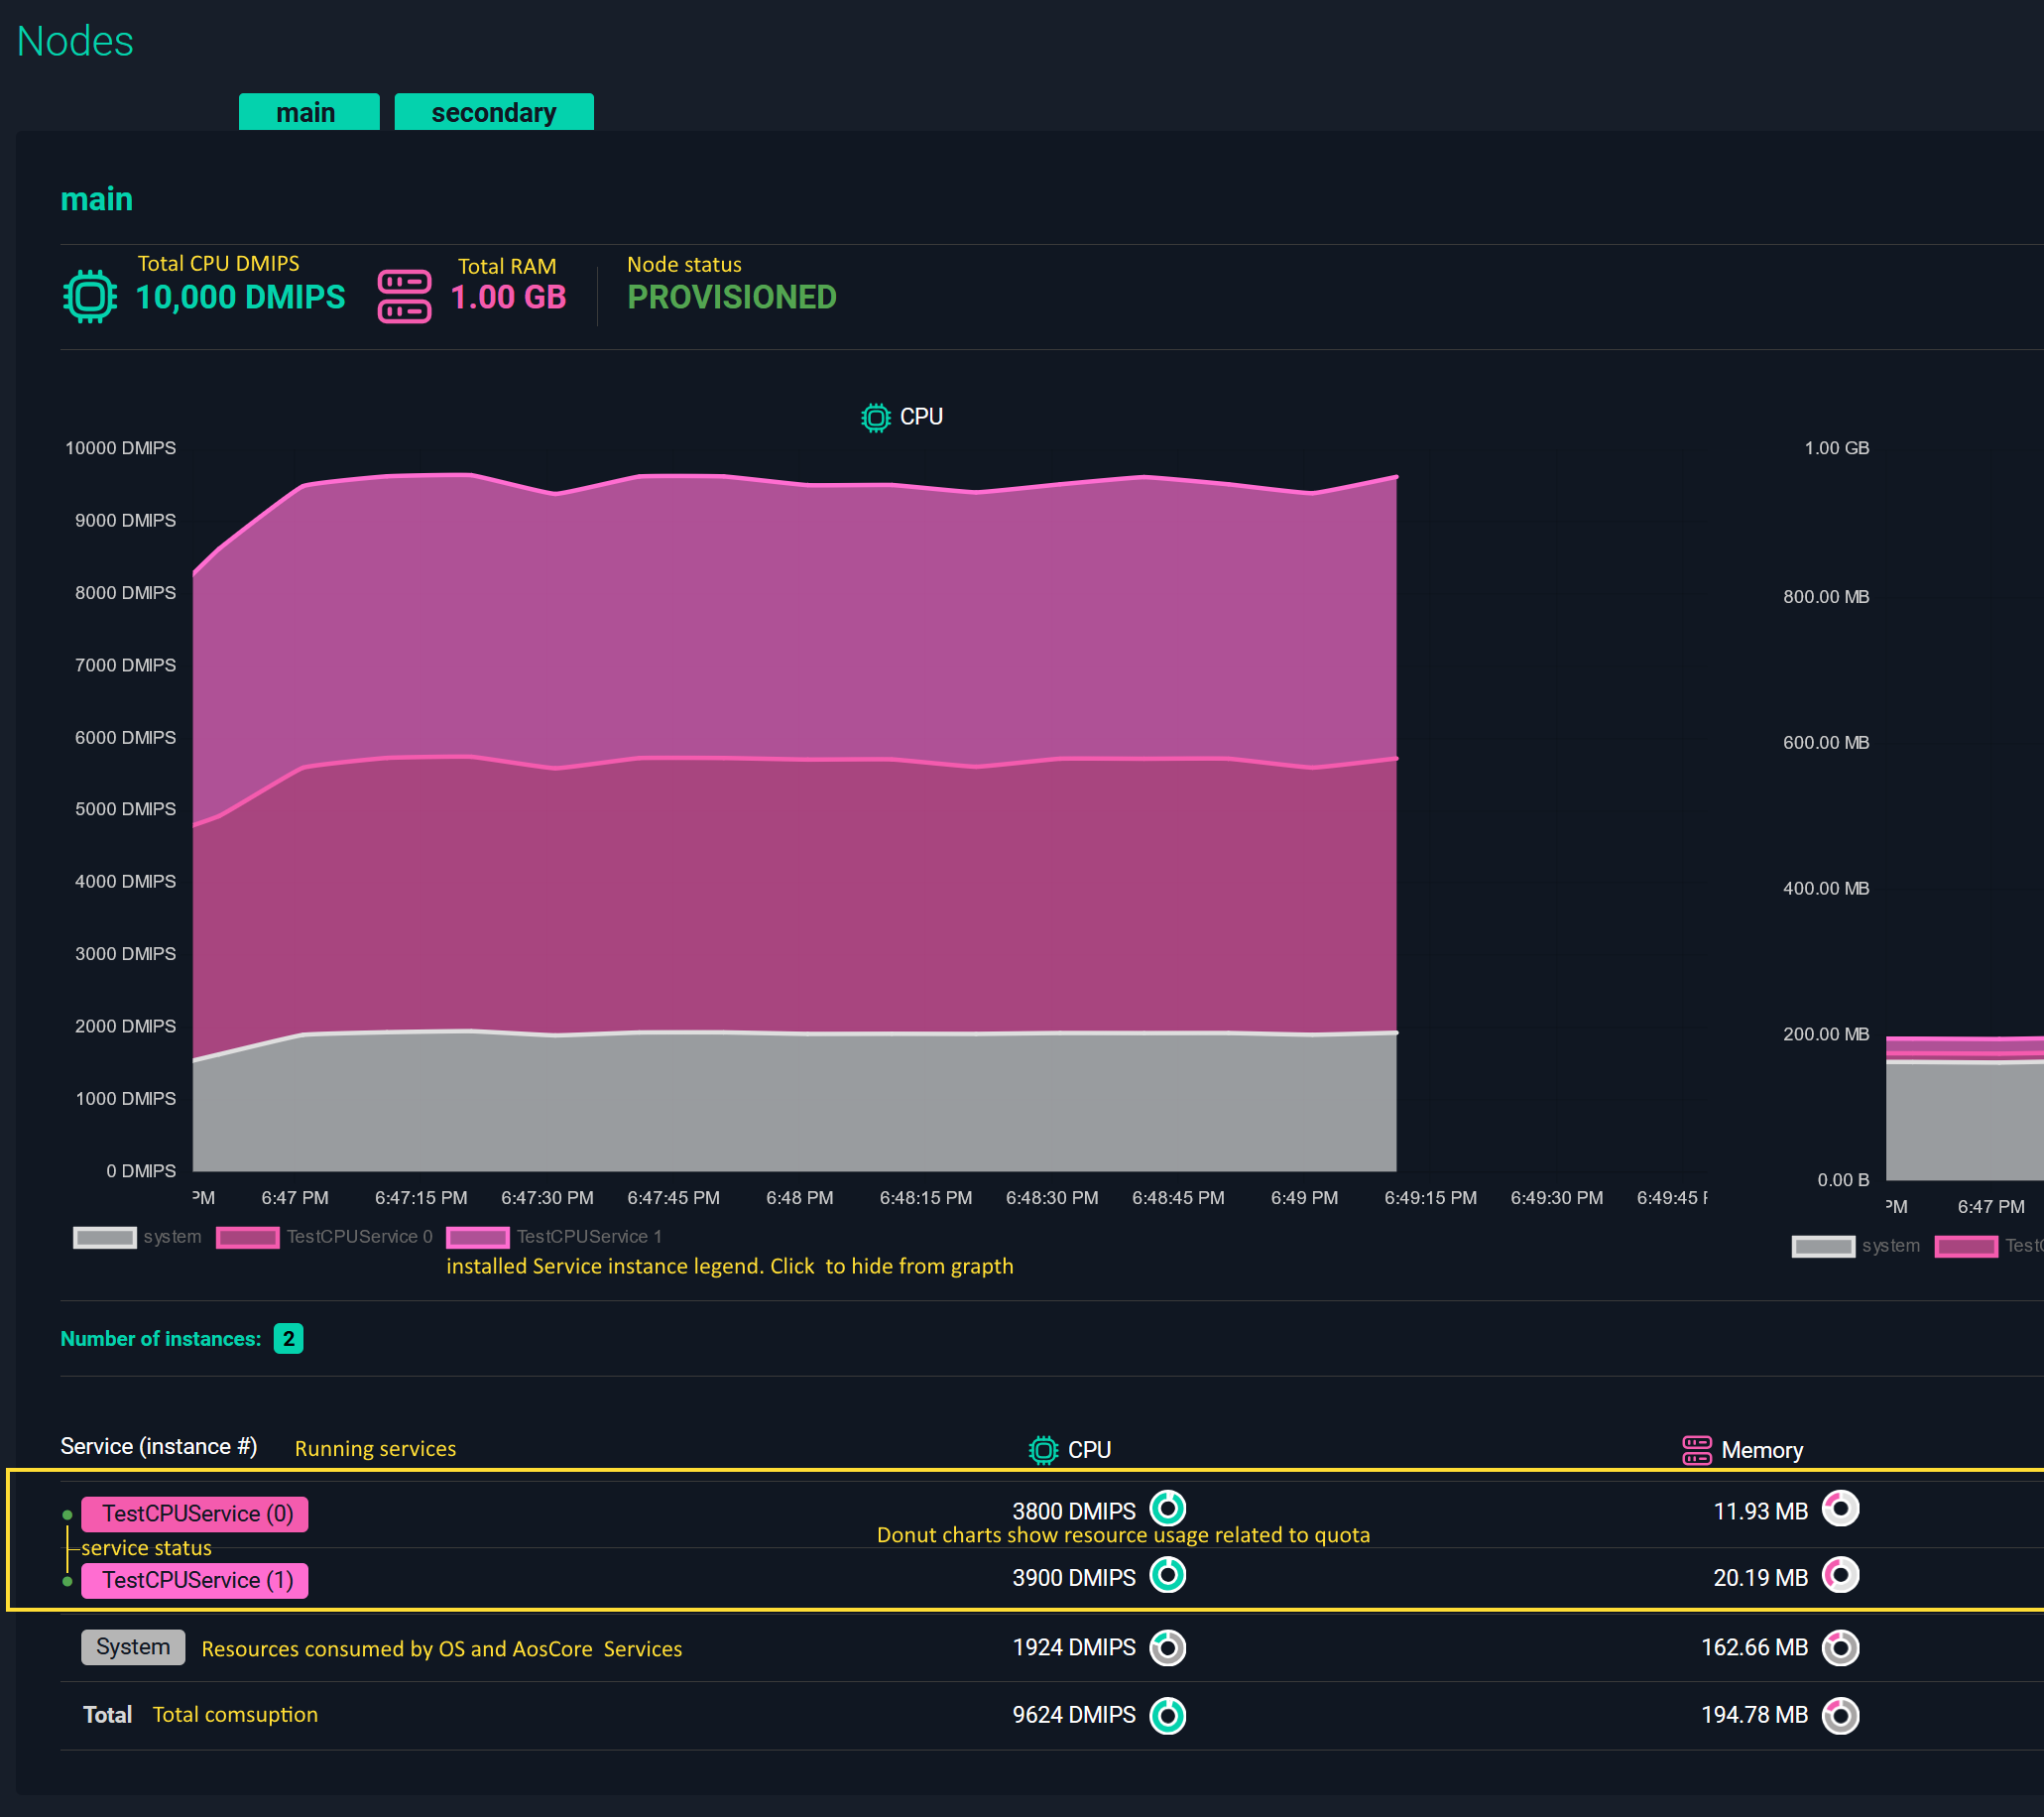
- On the top of the node, you may see available resources on the node and its status.
- Next is a timeline graph with consumed resources per service over time.
- At the bottom, you may see a list of installed Services with their monitoring. The Status of the service is displayed as green or red dot to the left service name.
Systemrow represent resource usage by OS and Core services.- Total is the sum of all above.
Settings
To open setting click on settings icon the top the Page. Refer to Overview chapter where to find it.
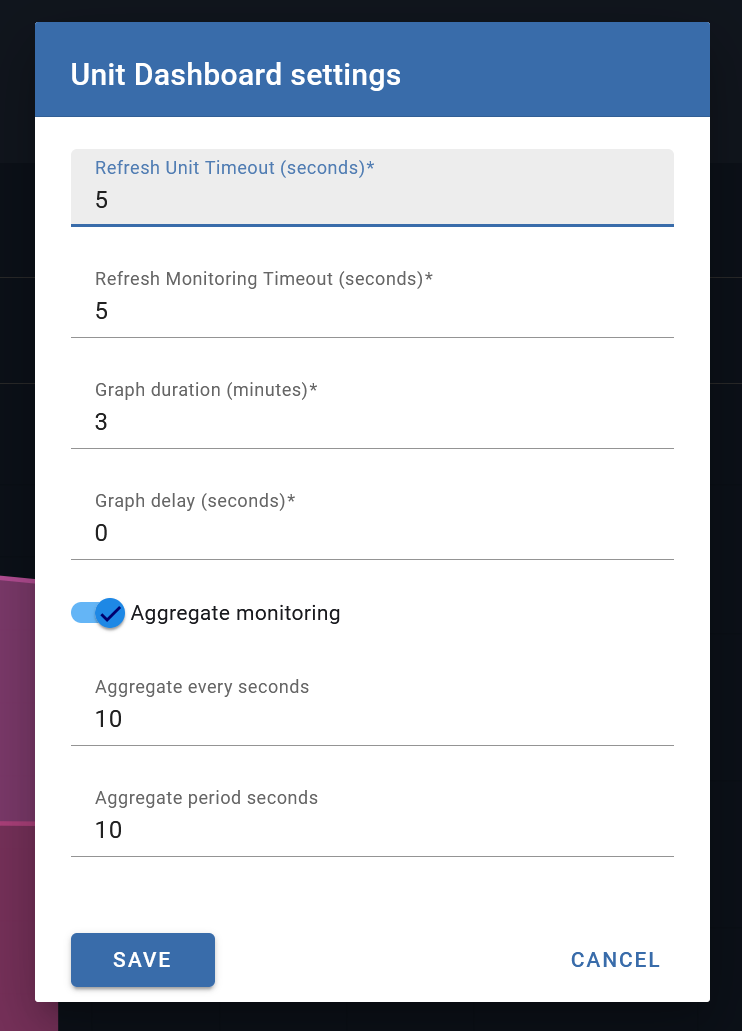
| Field | Size | Default | Description |
|---|---|---|---|
| Refresh Unit Timeout | Seconds | 5 | How often refreshes Unit status (online, offline), services status (running, installing, error, moved to another node). The less period, the sooner changes will be reflected |
| Refresh Monitoring Timeout | Seconds | 30 | How often monitoring information if pulled from server. The best parameter here is how often Unit is sending monitoring to the server. Default unit will send monitoring every 30 seconds. |
| Graph duration | Minutes | 3 | Period represented on timeline graph |
| Graph delay | Seconds | 30 | Pull timeline to the right for n seconds. This is usefull to hide empty chart on time while monitoring not received |
| Aggregate monitoring | Boolean | True | Should periods be aggregated |
| Aggregate every | Seconds | 10 | Duration of time between windows Influx docs |
| Aggregate period | Seconds | 10 | Duration of windows Influx docs |